We look forward to showing you Velaris, but first we'd like to know a little bit about you.


A Guide to NPS Survey Best Practices for Customer Success Managers
Discover the best ways to handle NPS surveys and make the most out of customer feedback.
The Velaris Team
June 19, 2026
NPS (Net Promoter Score) surveys are a staple of customer success teams in measuring customer loyalty and sentiment. The surveys are simple, but can offer significant insight into how your customers feel, and how likely they are to stay, expand, or churn.
Having said that, the value of NPS feedback depends on how well you design your surveys, when you send them, and how effectively you act on the feedback you receive.
By conducting NPS surveys right, CS teams can increase response rates and use feedback for improvement in customer experience and long-term growth. This blog will cover the best practices for doing exactly that.
Why NPS matters for Customer Success
Identifies churn risk and loyalty
NPS gives Customer Success teams a clear signal of how customers feel about your product. Promoters are more likely to renew and expand, while Detractors are at a higher risk of churning.
This link between loyalty and growth is a big reason NPS remains widely used. In Bain & Company’s research, differences in relative competitive NPS scores explain 10%—70% of the variation in revenue growth rates among direct competitors.
In other words, the loyalty signals identified by NPS can be directly tied to business goals like revenue, which is especially data to have in strategic conversations with C-suite.
Helps prioritize accounts
Not all customers require the same level of focus. NPS helps teams quickly segment accounts based on sentiment, making it easier to prioritize outreach. High-risk accounts can be flagged for immediate intervention, while satisfied customers can be nurtured for expansion and advocacy.
Enables targeted engagement strategies
Each segment needs a different response. Promoters are already sold — the question is whether you turn that goodwill into something concrete before it fades. Passives are the more interesting problem: they're not unhappy enough to say so, which means the gap between them and a Promoter is usually one underused feature or one missed check-in.
According to McKinsey, companies that excel at personalization generate 40% more revenue than their peers, proof that making the customer the center of your work pays off.
NPS survey best practices
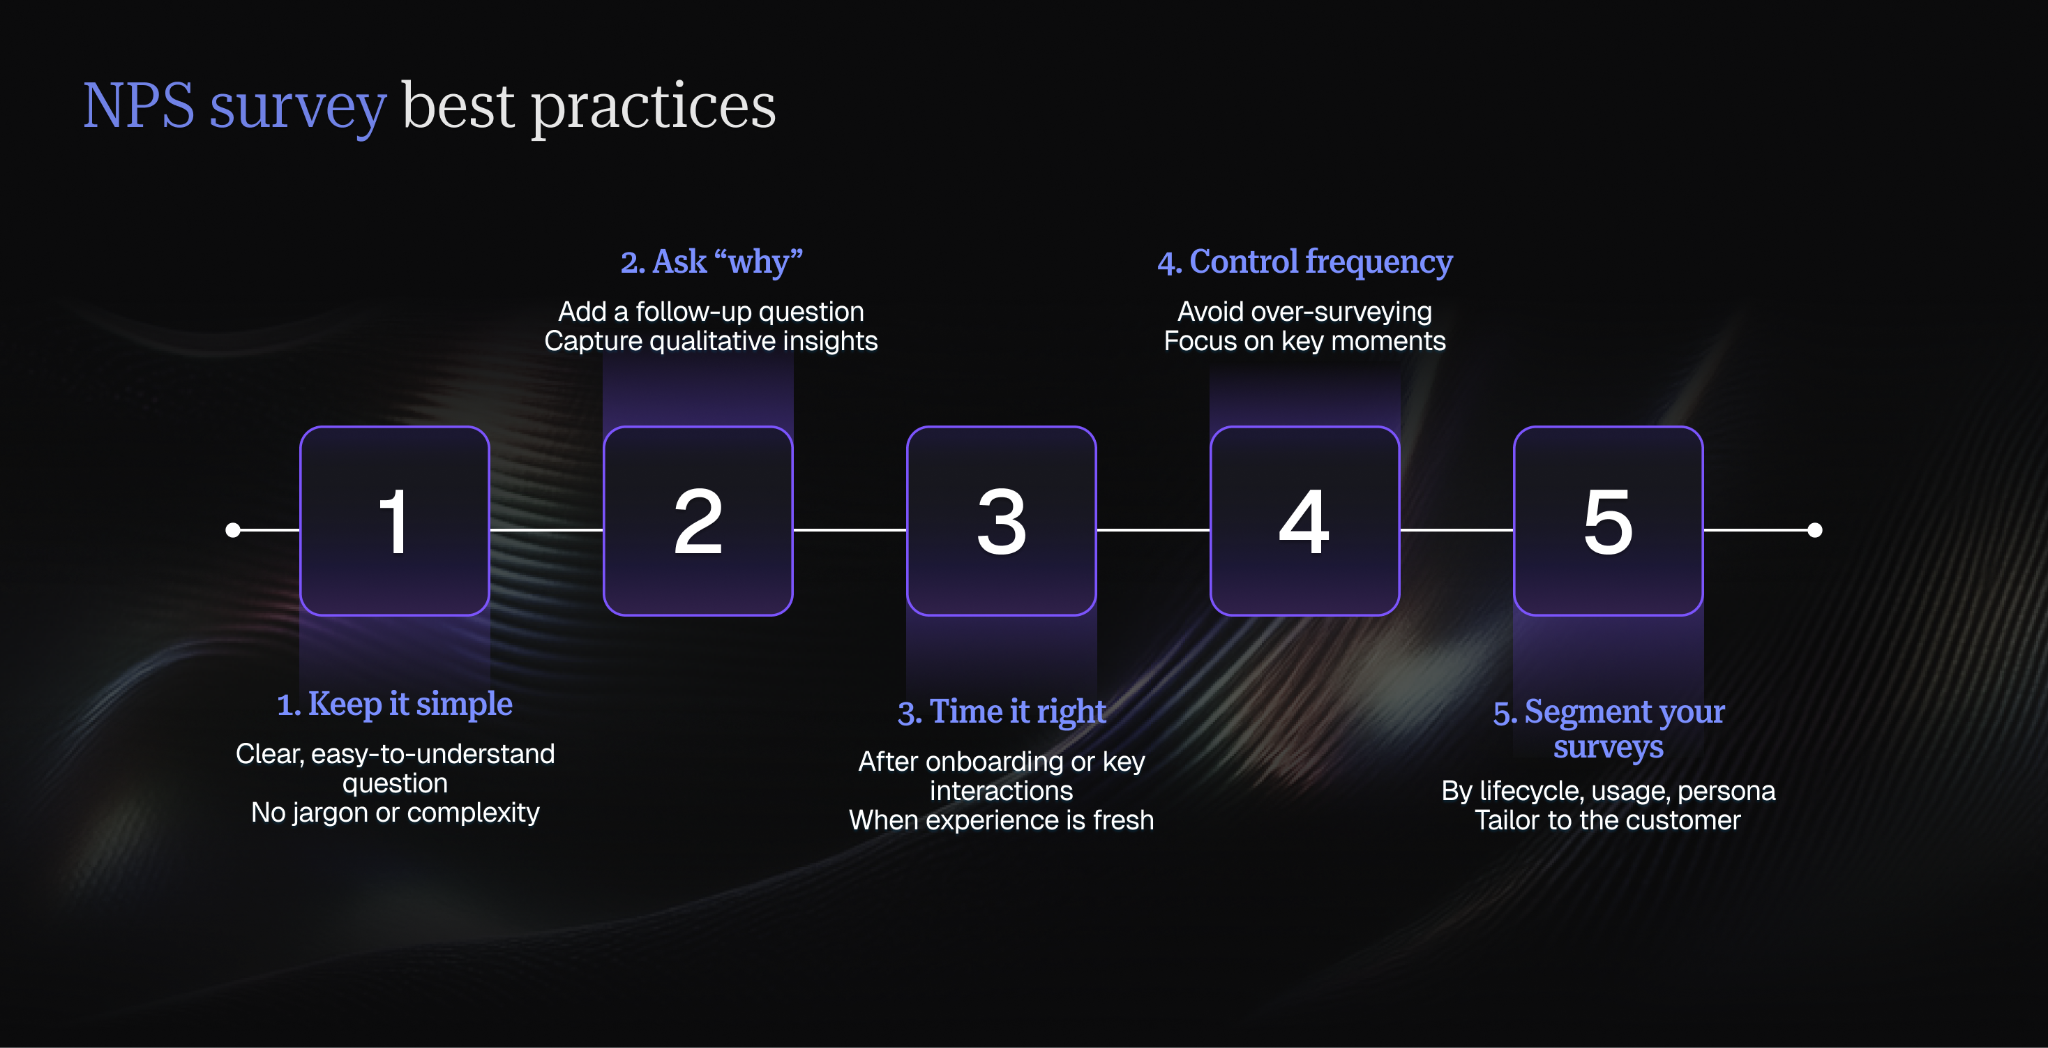
Keep surveys clear and concise
The standard NPS question has stayed the same for 20 years, because it works. The survey question is always along the lines of “On a scale of 0 to 10, how likely are you to recommend [Company/Product]?”
When you start adding qualifiers like, "based on your experience over the last 90 days" or "considering our product and support team", you're introducing variables that make scores harder to compare over time.
Ask follow-up questions
The NPS score alone only tells you what customers feel. As for why they feel that way is up to you to find out.
Include a follow-up question like “What is the primary reason for your score?”. Keep it open-ended. Prompted options bias the response toward the answers you thought to include.
Qualitative feedback in a NPS survey is often where the most valuable information can be unearthed. You might find specific pain points, feature requests, or areas of success.
Choose the right timing
Timing plays a critical role in the quality of responses. Surveys should be sent when the customer experience is still fresh, such as after onboarding or a key milestone in the lifecycle. This is so that feedback is more accurate, and reflective of recent experiences and changes.
Control survey frequency
While it’s important to collect feedback regularly, over-surveying can lead to fatigue. As a customer, being bombarded by never-ending surveys can get old quickly.
When customers receive too many survey requests, they are less likely to respond or may provide low-quality answers in an attempt to get them over with. Spacing out surveys and focusing on meaningful touchpoints helps maintain engagement and ensures better response quality.
But there’s more nuance to the issue, as Gartner says that despite marketers blaming “survey fatigue”, 81% of consumers say they provide feedback at least some of the time when asked. The problem is more often in the way surveys are positioned: invitations can be too long, vague, or impersonal. So be wary of putting all the blame on the quantity of surveys, when the quality of the surveys might be more relevant.
Segment your surveys
Not all customers should receive the same survey experience. Segmenting surveys based on factors like lifecycle stage, product usage, or customer persona makes feedback more relevant. Tailored surveys lead to more thoughtful responses and help teams better understand the needs of different customer groups.
How to increase NPS response rates
Response rates for B2B surveys are typically low, which makes optimization critical. On average, B2B survey response rates are at around 12.4%, meaning even small improvements in engagement can have a meaningful impact on the quality of insights you collect.
Personalize survey invitations
Generic survey requests are easy to ignore. Look to personalize invitations by using the customer’s name and referencing their recent activity.
You could even acknowledge the specifics of their relationship with your product to make the request feel more relevant. This increases the likelihood that customers will take the time to respond.
Use multiple channels
Different customers prefer different communication channels. Some respond better to email, while others engage more with in-app prompts or SMS. Using a mix of channels ensures you reach customers where they are most active, improving overall response rates.
Keep surveys short
Time is one of the biggest barriers to survey completion. Keeping surveys focused and quick to complete increases participation. The standard NPS question combined with a single follow-up question is often enough to gather meaningful insights without overwhelming the customer.
Communicate the value of feedback
Customers are more likely to respond when they understand why their feedback matters. Clearly explaining how their input will be used to improve the product or their experience can significantly boost participation. It reinforces that their voice has a real impact.
Relationship NPS vs. transactional NPS: how to choose
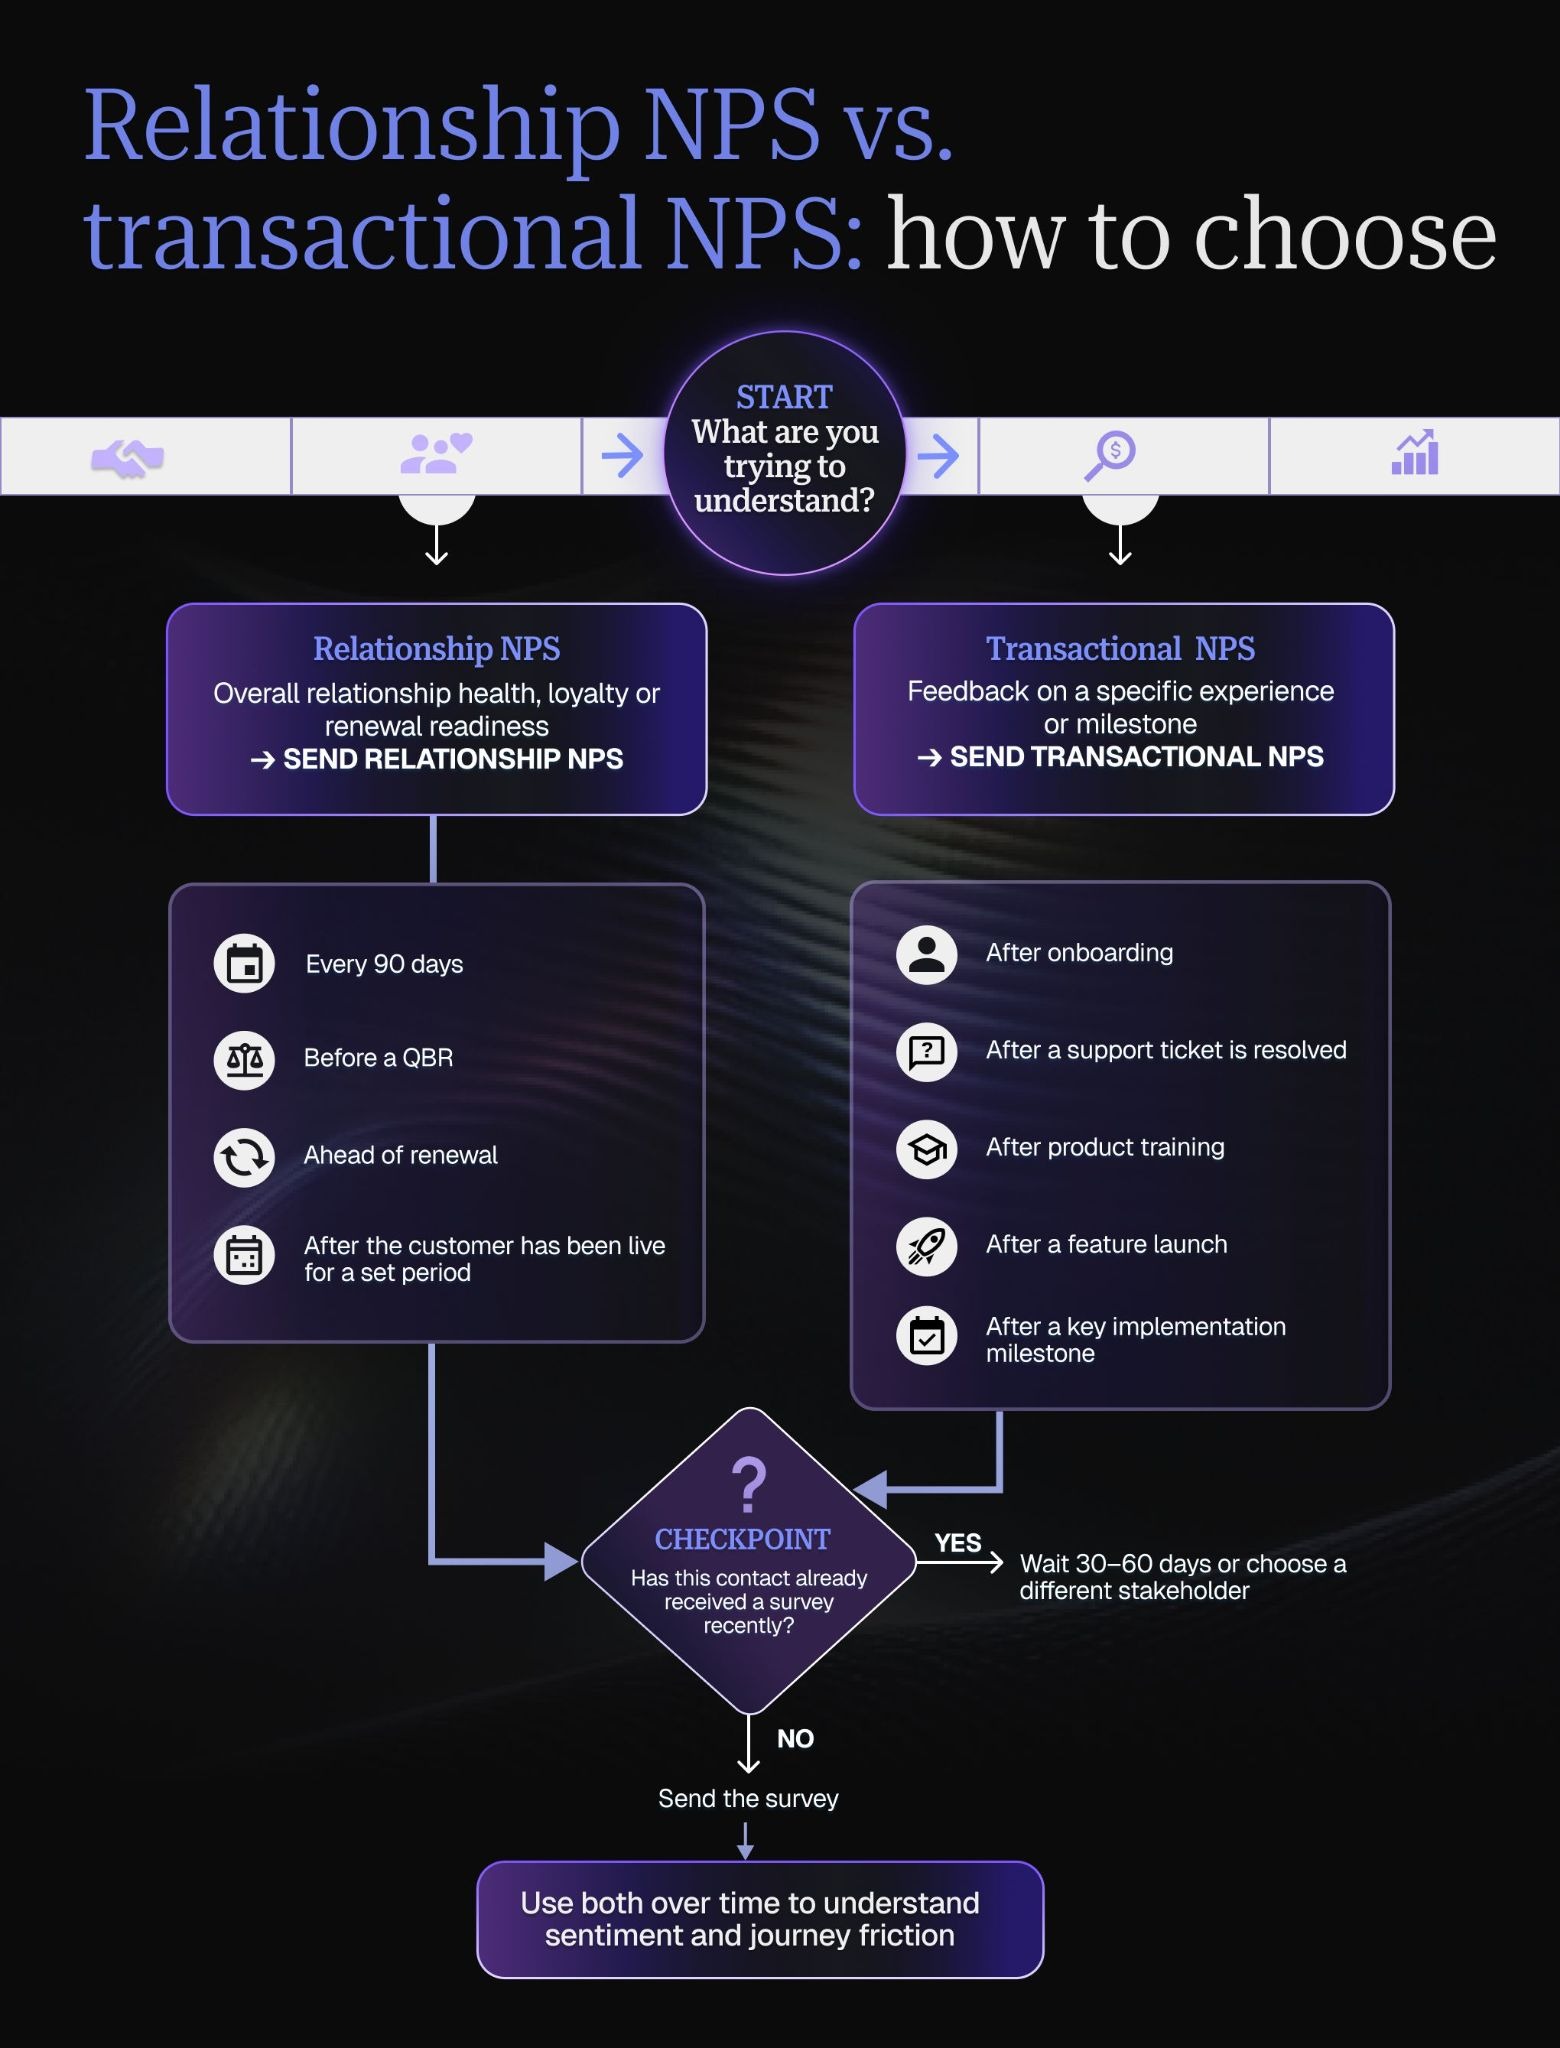
NPS surveys can be sent for different reasons, and therefore at different timings. A customer’s response can change drastically depending on whether you ask after a major product experience or during a general relationship check-in.
It’s crucial to understand the two main types of NPS that are sent, and how each one contributes to your understanding of the customer.
What is relationship NPS?
Relationship NPS (rNPS) is sent on a fixed cadence regardless of whether the customer has recently taken a specific action. It aims to understand how the customer feels about your company, product, and overall partnership.
For B2B customer success teams, rNPS is helpful for measuring account sentiment over time. You might spot changes in customer confidence, compare sentiment across segments, and identify accounts that may need attention before renewal conversations begin.
Common times to send relationship NPS include:
- Every 90 days
- Before or after a QBR
- Midway through the customer lifecycle
- Ahead of renewal planning
- After a customer has been live for a set period
Since rNPS is broader, it’s best used for understanding overall relationship health rather than diagnosing one specific issue.
What is transactional NPS?
Transactional NPS (tNPS) is triggered by a specific customer interaction or milestone. With rNPS the question was more of a “How do you feel about us overall?”. tNPS is targeted toward how a customer feels after a particular experience.
For example, you might send transactional NPS after:
- Onboarding is completed
- A support ticket is resolved
- A product training session takes place
- A new feature is launched
- A customer reaches a key implementation milestone
This makes tNPS especially useful for identifying friction points in the customer journey. If several customers give low scores after onboarding, the issue that is souring the scoring may not be reflective of the entire relationship. The survey helps you isolate it to the handoff, training, time to value, or implementation process.
Why B2B CS teams usually need both
Relationship NPS and transactional NPS answer different, but equally valuable questions.
Relationship NPS helps you understand the overall health of the customer relationship. Transactional NPS helps you understand how specific moments are affecting that relationship.
Using both gives CS teams a clearer view of customer sentiment. rNPS helps with lifecycle health, renewal planning, and account prioritization. tNPS helps pinpoint where friction is happening across onboarding, support, product adoption, and other key touchpoints.
How to avoid survey fatigue
Having stated the importance of using both rNPS and tNPS, the risk of doing so is that customers can quickly feel over-surveyed. This is especially true in B2B, where the same stakeholder may be involved in onboarding, support, QBRs, renewals, and product feedback.
To avoid survey fatigue, your team needs clear rules around timing. For example, avoid sending a relationship NPS survey immediately after a transactional one.
If a customer has already received a survey after onboarding, wait before sending a broader relationship survey.
It also helps to set limits at the account or contact level. A simple rule might be that one contact should not receive more than one NPS survey within a set period, such as 30 or 60 days.
A simple decision framework
To decide when to use each type of NPS, start with the question you are trying to answer.
Use relationship NPS when you want to understand overall sentiment, account health, or renewal readiness. Match the frequency to the length of your customer lifecycle.
For annual contracts, a quarterly or 90-day cadence may work well. For shorter renewal cycles, you may need a lighter but more frequent approach.
Use transactional NPS when you want feedback on a specific customer experience. Tie these surveys to meaningful journey milestones, not every small interaction. Good triggers include onboarding completion, support resolution, major product releases, training sessions, or expansion milestones.
Ultimately, you’ll want to be using both to maximize coverage of how a customer is feeling. You can check our article about the different types of NPS surveys to learn more about using transactional and relationship NPS surveys.
How to analyze NPS data effectively
Understand your NPS score
Analyzing NPS starts with understanding how the score is calculated and what it represents. NPS is derived by subtracting the percentage of Detractors (scores 0–6) from the percentage of Promoters (scores 9–10), resulting in a score between -100 and +100.
While the number itself is useful, it should not be viewed in isolation. The real value comes from understanding what is driving that score and how it changes over time.
You can use this NPS calculator to help you.
Know what counts as a good NPS score
A “good” NPS score depends heavily on your industry, customer type, and product maturity. In SaaS and tech, many mid-market B2B companies often treat scores in the 30–50 range as healthy, but cross-industry averages can be misleading for customer success decisions.
A fintech platform, HR tech tool, and professional services company may all have different baseline expectations because the customer experience, risk level, and relationship model vary. If reliable external benchmarks are unavailable, compare your NPS against your own historical trend.
A declining score within your own benchmark can be more actionable than a comparison to a competitor.
Check out this blog on NPS score benchmarks to learn more about what counts as a good score.
Identify trends over time
A single NPS snapshot only tells part of the story. Tracking NPS over time helps you understand whether customer sentiment is improving, declining, or remaining stable.
Patterns such as consistent drops after onboarding or improvements following product updates can reveal where your Customer Success efforts are working and where they need attention.
Segment feedback by customer groups
Not all customers experience your product in the same way. Segmenting NPS data by factors like lifecycle stage, product usage, account value, or industry helps uncover more specific insights. For example, new customers may have different challenges than long-term users, and identifying these differences allows for more targeted action.
Turn qualitative NPS responses into actionable themes
You will often find that the open-text “why” behind an NPS score is more useful than the number itself; it tells CS teams what to act on, as opposed to them trying to guess.
For smaller datasets, start by manually coding responses into a simple theme taxonomy, such as onboarding friction, feature gaps, support quality, product usability, or ROI realisation.
At scale, keyword clustering or AI topic extraction can help demonstrate recurring patterns faster. It is also important to connect themes to lifecycle stages.
Share the insights you get cross-functionally: product gets feature gaps, support gets friction data, and CS gets churn risk signals.
Use visualization tools
Large volumes of NPS data can be difficult to interpret without proper visualization. Dashboards, charts, and trend lines make it easier to spot patterns, compare segments, and communicate insights across teams. Clear visualization helps turn raw data into actionable insights that can guide decision-making.
By combining score interpretation, trend analysis, segmentation, and visualization, NPS data becomes a powerful tool for understanding customer sentiment and driving meaningful improvements.
How to act on NPS feedback
Respond to Promoters
Promoters are your most satisfied customers and a key driver of growth. The goal is to strengthen the relationship and turn their positive sentiment into advocacy. This starts with acknowledging their feedback and showing appreciation.
From there, you can encourage them to share reviews, participate in case studies, or refer others. When nurtured properly, Promoters become long-term champions of your product.
Respond to Passives
Passives are neutral customers who are not dissatisfied, but aren't entirely convinced of your product’s value. This demographic is a significant opportunity for improvement.
To grasp that opportunity, put effort into understanding what is holding them back and identify areas where their experience can be enhanced. Targeted engagement, incentives, better onboarding, or highlighting underused features can help move them toward becoming Promoters.
Respond to Detractors
Detractors require immediate attention, as they are at the highest risk of churn. The priority is to acknowledge their concerns, understand the root cause, and take clear steps to resolve the issue.
Responding quickly and with empathy can help rebuild trust. While not every Detractor can be recovered, addressing their feedback proactively can significantly reduce churn and improve overall customer sentiment.
How to automate NPS surveys
Identify key touchpoints
Automation starts with choosing the right moments to collect feedback. Instead of sending surveys randomly, identify key touchpoints in the customer journey where feedback will be most relevant.
This could include after onboarding, following a support interaction, during product adoption milestones, or ahead of renewal periods. Targeting these moments ensures feedback is timely and meaningful.
Set up triggers and workflows
Once touchpoints are defined, automation can be built around them. Triggers can be based on time (e.g. 30 days after onboarding) or behavior (e.g. after a support ticket is closed or a feature is used).
Workflows are what guarantee that surveys are sent consistently, sidestepping the risk of forgetting to gather feedback at opportune moments.
Automate follow-ups
Collecting feedback, believe it or not, is only a part of the process. Automating follow-ups is what allows for responses to be acknowledged and acted on.
For example, Promoters can receive thank-you messages or advocacy requests, while Detractors can trigger alerts for immediate intervention. With automation, teams can respond with fast and consistent messaging and action.
Scale feedback collection
Automation allows Customer Success teams to collect feedback across a large customer base without increasing workload. If you want to go a step further in efficiently automating feedback collection, you might want to consider autonomous AI workflows for running NPS surveys.
Using AI automation for this would put you much further ahead of competitors, as proven by Velaris’ State of AI in Customer Success report: only 13% of teams use AI in multi-step rule-based automation flows and just 3% have AI executing complex tasks autonomously.
By standardizing surveys, triggers, and follow-ups, especially with the help of AI, teams can maintain quality while scaling their efforts. This ensures that feedback is continuously collected, analyzed, and acted on as the business grows.
Integrating NPS insights into your Customer Success strategy
To maximize the impact of your NPS surveys, it’s essential to integrate the insights you gain into your broader Customer Success strategy. This ensures that feedback translates into actionable improvements across your organization. Here’s how to effectively incorporate NPS data into your Customer Success efforts:
Align NPS data with customer health scores and other metrics
Combine NPS scores with other key performance indicators (KPIs) such as customer health scores, churn rates, and product usage metrics. This holistic approach helps you understand the full context of customer satisfaction and identify specific areas that need attention.
Over time, NPS can also become part of predictive health scoring. Historical NPS trends, product usage, support volume, stakeholder engagement, and renewal timing can help you identify patterns that typically show up before churn or expansion.
But remember to refrain from treating the NPS score alone as the prediction. It should be one signal in a wider model of customer health.
Aligning the multitude of metrics you monitor alongside other data provides a more comprehensive view of your customers' overall experience, which in turn helps you to make informed decisions and coordinate efforts more effectively.
Set NPS escalation thresholds: when to act and how fast
Tie NPS to clear intervention rules. Defining thresholds that trigger specific actions can be a lot more helpful than just telling CSMs to “follow up with detractors.
For example, a single transactional NPS score below 5 could require a CSM response within 48 hours, while two consecutive relationship NPS drops of 2+ points could trigger executive outreach or an account review.
There can also be other contextual factors to consider; for instance, a passive score from a high-value account may also deserve attention if renewal is near.
Create success plans based on NPS feedback
Develop tailored success plans that address the specific feedback from your NPS surveys. For example, if a segment of customers expresses dissatisfaction with onboarding, create a detailed plan to improve that process.
These plans should include clear objectives, timelines, and KPIs to track progress and ensure that customer concerns are effectively addressed.
Utilize cross-functional collaboration to drive improvements
NPS feedback often touches multiple areas of your organization, from product development to customer support. Foster cross-functional collaboration by sharing insights with relevant teams and working together to implement changes.
Regularly scheduled meetings and integrated project management tools can facilitate this collaboration, ensuring that feedback leads to coordinated, organization-wide improvements.
Velaris can help you break down data silos by connecting the tools used across various departments, allowing seamless data sharing and a unified view of customer interactions.
Train CSMs in using NPS data
It also helps to train CSMs on how to interpret and use NPS data consistently. One CSM might treat a Passive score as low priority while another may escalate it immediately. Which one is correct depends on various factors, and so the team needs guidance on how to understand NPS correctly.
Create simple internal rules for what each score range means, when to follow up, what to document, and when to involve product, support, or leadership. You will want to make NPS less dependent on individual judgment and more consistent as a team-wide operating system.
Integrating NPS insights into your Customer Success strategy is crucial for continuous improvement. By aligning data, creating targeted success plans, and fostering collaboration, you can ensure that feedback drives meaningful change.
Following this practice, streamlining the distribution and following-up NPS surveys through automation is another procedure with its advantages. The next section will look more into this.
NPS vs CSAT vs CES: which should you use?
Differences between metrics
NPS, CSAT, and CES each measure a different aspect of the customer experience, and understanding these differences is key to using them effectively.
NPS (Net Promoter Score) measures overall loyalty by asking how likely a customer is to recommend your product. It gives a high-level view of long-term sentiment and is often used as a leading indicator of retention and growth.
CSAT (Customer Satisfaction Score) measures satisfaction with a specific interaction, such as a support experience, onboarding session, or feature usage. It provides more immediate, transactional feedback.
CES (Customer Effort Score) measures how easy it is for customers to complete a task, such as resolving an issue or using a feature. It focuses on friction in the customer experience, which is often a strong predictor of dissatisfaction.
When to use each
Each metric serves a different purpose, so the best approach is to use them together rather than choosing just one.
Use NPS when you want to understand overall customer sentiment and identify trends in loyalty over time. It works well at key lifecycle moments such as quarterly check-ins or before renewals.
Use CSAT when you need feedback on specific interactions. For example, after a support ticket is resolved or after onboarding is completed. This helps you evaluate and improve individual touchpoints.
Use CES when you want to identify friction in the customer experience. It is especially useful for understanding how easy it is for customers to achieve their goals, such as completing a workflow or resolving an issue.
By combining all three, Customer Success teams can get a more complete view of the customer experience, from high-level sentiment to specific interactions and underlying friction points.
Common mistakes in NPS surveys
Poor timing
Even well-designed surveys can fail if they are sent at the wrong time. Asking for feedback too long after an interaction can result in vague or inaccurate responses, while sending it too early may not capture the full experience. Timing surveys around key touchpoints, such as after onboarding or support interactions, ensures feedback is relevant and actionable.
Ignoring qualitative feedback
Focusing only on the NPS score and ignoring the “why” behind it is a major missed opportunity. The qualitative responses often contain the most valuable insights, highlighting specific issues, feature gaps, or areas of success. Without analyzing this feedback, teams risk missing the context needed to take meaningful action.
Rethinking baselines when a champion leaves
Treating NPS trends as fully reliable after a key stakeholder leaves can be detrimental. If your champion gave consistently high scores, those scores may no longer reflect the account’s current relationship health.
The incoming contact has different expectations, priorities, and context, so the old benchmark can become misleading. When champion churn happens, mark the account’s NPS history as pre-transition data and re-establish a new baseline.
Send a relationship NPS survey after the new stakeholder has been properly onboarded, not immediately after the handover. Then compare future scores against this new baseline, while using past responses with the caveat that they should be treated as historical context.
Relying on NPS when product usage tells a different story
A common mistake in product-led growth companies is treating NPS as the main measure of customer loyalty when product data is already showing a clearer signal. Daily active usage, feature adoption, workflow depth, and in-product engagement can be more telling about risk before a quarterly survey is.
For example, a customer may give a strong NPS score but gradually stop using key features, or give a neutral score while usage is increasing across the account. In PLG environments, NPS should not be replacing product analytics.
Use surveys to understand sentiment, but compare every response against usage trends before deciding whether an account is genuinely healthy or at risk.
Not acting on results
Collecting NPS data without taking action is one of the biggest pitfalls. When feedback is not addressed, it not only limits the value of the survey but can also damage customer trust. Customers expect their input to lead to improvements. Turning insights into actions, and communicating those actions back to customers, is what makes NPS truly impactful.
Tools for managing NPS surveys
Survey tools
Survey tools are the foundation of any NPS program. They allow teams to create, distribute, and collect responses at scale. These tools typically support standard NPS formats, follow-up questions, and basic segmentation.
While they are effective for collecting data, they often operate in isolation and require additional systems to turn feedback into action.
Customer Success platforms
Customer Success platforms connect NPS data to the broader customer lifecycle. Instead of treating surveys as standalone inputs, these platforms integrate feedback with customer health, usage, and engagement data.
This allows teams to prioritize accounts, trigger follow-ups, and embed NPS into everyday workflows rather than managing it separately.
Analytics tools
Analytics tools help teams make sense of NPS data by identifying trends, patterns, and correlations. They enable segmentation, reporting, and visualization, making it easier to understand how customer sentiment evolves over time and what factors are influencing it.
How Velaris helps with NPS
Platforms like Velaris, which is well-rated on G2, are a step above basic survey management when it comes to connecting feedback directly to execution. Velaris is an AI customer success tool that can automate survey distribution based on lifecycle stages or customer actions, ensuring feedback is collected at the right moments without manual effort.
It also enables intelligent segmentation, allowing surveys to be tailored to different customer groups for more relevant insights. Once responses are collected, Velaris uses AI to surface key themes and patterns, helping teams quickly understand what is driving customer sentiment.
Most importantly, Velaris connects NPS feedback to workflows and actions. Think of, for example, automatic triggering of follow-ups for Detractors. Or identifying expansion opportunities from Promoters. The platform could also have use in feeding insights into broader Customer Success strategies.
The practical difference of using Velaris is that a Detractor score at 11pm doesn't wait until someone notices it Monday morning, or a Promoter score doesn’t get dismissed as an achievement that requires no further follow-up.
Conclusion
NPS is a useful metric, but it might be better to not run the survey at all if you don’t do it right; at least you’re saving resources that way. NPS only becomes really valuable when you make the survey right, send it out at the right times, and be actionable with the information you get out of it.
But conducting high-quality NPS surveys can become strenuous as your customer base grows. That’s when you need automation and integration to make the process scalable. You need feedback collected at the right time, connected to the right data, and translated into consistent action without wasting too much manpower on it.
Platforms like Velaris, a highly rated software on G2, enable this by bringing together survey automation, AI-driven insights, and workflow execution. This allows Customer Success teams to move from collecting feedback to acting on it at scale.
Book a demo to see how Velaris helps you act on NPS insights.
Frequently Asked Questions
Why does NPS drop 60–90 days after onboarding?
NPS often dips low 60–90 days after onboarding because the customer has moved from initial setup into real day-to-day usage. At onboarding completion, sentiment can be high because the launch looks successful and everyone is optimistic. But after a few months, customers may start noticing workflow gaps, low internal adoption, missing features, unresolved training needs, or slower-than-expected ROI.
Don’t take this drop lightly. Compare onboarding NPS with 60-day and 90-day scores, then review the open-text responses to understand what changed. If sentiment is declining, intervene with an adoption review, workflow training, stakeholder check-in, or success plan update before the issue becomes a renewal risk.
How do you handle multi-contact NPS scores?
In B2B accounts, a single NPS score might not capture the full picture. An economic buyer might give a 9 because they see strategic value, while a project manager gives a 7 because implementation is messy, and daily users give a 4 because the product feels difficult to use.
Taking an average of these scores is not the way to go, since that would just hide a very real churn risk.
Instead, segment NPS responses by stakeholder role and look for gaps between executive sentiment and user sentiment. If end-user scores are consistently low, treat that as a risk signal even if the champion is satisfied.
How often should you send NPS surveys?
NPS surveys should be sent at meaningful moments rather than on a fixed schedule alone. Common approaches include quarterly surveys or triggering them at key lifecycle stages such as onboarding completion, major feature adoption, or before renewal. The key is to balance consistency with avoiding survey fatigue.
Can NPS predict churn?
NPS can be a strong leading indicator of churn risk, especially when combined with other signals like product usage and engagement.
Detractors are, of course, significantly more likely to churn. But NPS should not be used in isolation; pairing it with customer health data provides a more accurate prediction.
What should you do after receiving NPS responses?
After collecting responses, the priority is to act on them. This includes responding to customers, identifying patterns in feedback, and turning insights into actions such as product improvements or targeted outreach. Closing the feedback loop by communicating changes back to customers is also essential.

The Velaris Team
A (our) team with years of experience in Customer Success have come together to redefine CS with Velaris. One platform, limitless Success.





Velaris is an AI-native Customer Success Platform built for mid-market and enterprise B2B SaaS teams. From customer health scoring and churn prediction to onboarding automation, renewals, and expansion workflows, Velaris helps recurring revenue teams understand account health, reduce churn, and scale customer success with greater visibility and control.