We look forward to showing you Velaris, but first we'd like to know a little bit about you.


Why Churn Analysis Matters
Churn analysis is crucial for subscription-based businesses to understand why customers leave. It offers insights to retain existing customers and attract new ones, particularly vital for sectors like SaaS. By tracking and addressing churn factors, companies can enhance customer experience, allocate resources efficiently, and predict potential churn.
The Velaris Team
June 19, 2026
Churn analysis is an investigation of why customers leave, and using those insights to improve retention and foster long-term growth. For SaaS companies, revenue is almost entirely dependent on renewals. Therefore, understanding churn is critical to building a sustainable business.
Customer success teams are responsible for combatting churn before the process even begins. Data, segmentation, predictive insights, and analytics are some of the resources they have available to implement a proactive churn reduction strategy.
This article will detail the key elements of churn analysis, and best practices in eliminating churn to reach better customer outcomes and revenue growth.
Key takeaways
- Churn analysis aids your understanding of why customers leave, and offers essential insights for improving retention in SaaS
- Not all churn is the same. Tracking different types like revenue churn, voluntary churn, and early churn provides a more holistic view
- Key metrics like churn rate, CLV, NRR, and product usage provide a complete view of customer health
- Effective churn analysis follows a structured process: collect data, segment customers, identify patterns, find root causes, and take action
- AI is increasingly playing a more vital role in detecting churn risk early, and conducting effective analysis automatically
What is churn analysis?
Churn analysis is a method to understand when and why customers stop using your product or service, and then using those insights to reduce future churn.
Customer success teams typically track customer behavior and analyze patterns among accounts. The patterns are often symptomatic of root causes, which once revealed, allow the CS teams to address it and minimize churn proactively.
Why it matters in subscription and SaaS models
Churn hits the wallet hard. In SaaS and subscription businesses, revenue runs thin if customers don’t stay and renew over time.
You might think the impact on short-term revenue when a customer is lost is the worst of it. But the loss of lifetime value and effect on long-term growth of your business is what is most crushing.
This is why it’s more or less mandatory to run churn analysis, which helps teams:
- Identify at-risk customers early
- Understand gaps in onboarding, product experience, or support
- Improve retention and expansion strategies
According to the Harvard Business Review, acquiring a new customer can cost 5 to 25 times more than retaining an existing one. So it's worth every penny when you invest into churn analysis and retaining existing customers, because acquiring new ones is incredibly expensive in comparison.
Your profitability is directly proportional to how effective your churn analysis and retention strategies are.
Simple example of churn analysis in practice
Imagine a SaaS company notices a sharp increase in churn among customers within the first three months.
By analyzing usage data, support tickets, feedback, and other relevant data, they discover that many customers are not adopting a key feature during onboarding. This is a lack of early value; eventually, this leads to disengagement and churn.
Bearing this in mind, the team updates their onboarding process to highlight that feature and incentivize customers to use it. They add guided tutorials and trigger proactive check-ins for low-usage accounts.
Consequent to their improvements, more customers reach value faster, and churn in the early lifecycle stage decreases markedly. This is one example of how churn analysis can make a significant difference in a practical scenario.
What causes customer churn?
It’s quite rare for a single reason to be the catalyst for customer churn. Typically, it’s the collective result of gaps across the customer journey, from onboarding to ongoing engagement.
Let’s establish a clear understanding of these root causes, as being familiar with them is crucial for our strategies to prevent churn.
Poor onboarding
Onboarding is where customers form their first impression of your product. If the process is a mess, i.e. unclear, unstructured, or overwhelming, customers may struggle to see value early on.
When customers don’t see a clear path to succeeding with your product, disengagement and eventual churn is inevitable.
Lack of product adoption
It’s easy to forget that, even if customers complete onboarding, they may not have fully adopted the product.
Look out for low usage, limited feature adoption and shallow feature usage, or inconsistent engagement. These are strong indicators that customers are not entirely realizing value.
Over time, the lack of complete adoption erodes their incentive to continue using the product, because they are not getting the intended full experience.
Misaligned expectations
Though it might be counterintuitive, churn can actually begin before the customer even starts using the product.
Customers can feel disappointed or misled if they have certain expectations set during the sales stage, but this is disconnected to their actual experience of using the product.
A misalignment of this sort can be frustrating for a customer, and they might feel cheated by their purchase, even if the product itself is a good one.
Post-goal value gap
Ironically, some customers churn not because they failed, but because they achieved the goal they bought your product for.
Once the original problem is solved, why should they keep paying for your product? They may no longer see a clear reason to keep investing unless the next value horizon is defined.
This often happens after a successful onboarding, implementation, campaign, or strategic project.
To prevent it, CS teams need to re-anchor value before the first goal is fully completed.
They might need to question what success should look like next, introducing new use cases, and connecting the product to the customer’s evolving priorities.
Without that next step, even a successful customer can become a churn risk.
Poor support experience
When customers encounter issues, the quality of support they receive plays a critical role. 32% of customers will leave a brand they love after just one bad experience, which shows how thin the line is.
Slow response times, unresolved issues, or lack of personalization can wear away trust. A negative support experience can turn a small problem into a reason to leave.
Pricing or value mismatch
Customers continuously evaluate whether your product is worth the cost.
If they don’t see a clear return on investment, whether due to limited usage, unclear value, or changing needs, they may decide to cancel.
Types of churn you need to track
Not all churn is the same. Breaking it down into different types helps you understand where and why customers are leaving, and what actions to take.
Customer churn vs revenue churn
Customer churn measures the number of customers who leave over a given period. It answers: How many customers are we losing?
Revenue churn measures how much revenue is lost from those customers. It answers: How much business impact does that churn have?
These can tell very different stories. Losing many small accounts may not impact revenue much, while losing a few high-value customers can have a significant effect.
Voluntary vs involuntary churn
Voluntary churn happens when customers actively choose to leave. This is usually due to dissatisfaction, lack of value, or better alternatives.
Involuntary churn occurs when customers leave unintentionally, often due to failed payments, expired cards, or billing issues.
While voluntary churn requires improving the product or experience, involuntary churn can often be reduced with better billing processes and reminders.
Early churn vs late-stage churn
Early churn happens shortly after onboarding, often within the first few weeks or months. This usually points to issues with onboarding, time to value, or expectation mismatch.
Late-stage churn occurs after customers have been using the product for a longer period. This is often linked to declining engagement, changing needs, or lack of ongoing value.
Downgrade churn vs cancellation churn
Cancellation churn happens when a customer leaves entirely, while downgrade churn happens when they reduce seats, move to a lower tier, remove add-ons, or renew at a lower value.
Downgrade churn may not appear in logo churn, but it can quietly reduce NRR and signal declining value.
Track downgrade risk by monitoring usage depth, inactive seats, feature adoption, support sentiment, renewal conversations, and stakeholder engagement. If an account is using fewer features, reducing active users, or questioning ROI, treat it as an early churn risk even if they have not mentioned cancellation.
Key metrics used in churn analysis
Churn analysis relies on a set of core metrics that help teams understand not just who is leaving, but why and what it means for the business. Looking at these metrics together gives a more complete picture of customer health and retention.
Churn rate
Churn rate measures the percentage of customers who leave over a given period.
It’s the most direct indicator of customer loss and is typically calculated monthly or annually. Tracking churn rate over time helps identify trends, sudden spikes, or improvements after changes are made.
Check out this churn rate calculator to calculate your churn rate.
Customer lifetime value (CLV)
Customer Lifetime Value (CLV) estimates the total revenue a business can expect from a customer over their entire relationship.
CLV helps contextualize churn by showing the long-term impact of losing a customer. High churn reduces CLV, while improving retention increases overall revenue per customer.
Net revenue retention (NRR)
Net Revenue Retention (NRR) measures how much revenue is retained from existing customers, including expansions and contractions.
Retention is closely tied to growth. ChartMogul’s analysis of more than 2,100 SaaS businesses found that companies with net retention above 100% have an average annual growth of 43.6% compared with 13.1% for businesses with net retention below 60%.
So a high NRR means that even if some customers churn, growth from existing accounts offsets those losses. It’s a key metric for understanding the overall health of a SaaS business.
Product usage and engagement
Usage and engagement metrics show how actively customers are interacting with your product.
Common indicators include:
- Login frequency
- Feature adoption
- Time spent in the product
Declining engagement is often one of the earliest warning signs of churn.
Customer health score
A customer health score combines multiple data points, such as usage, support activity, and sentiment, into a single indicator of account health.
It helps teams:
- Quickly identify at-risk customers
- Prioritize accounts for intervention
- Track changes in customer status over time
How to perform churn analysis step-by-step
Collecting data alone does not amount to effective churn analysis. You need to take that data and convert it into productive actions.
A structured process makes it easier to identify what’s driving churn and where (and how) to intervene.
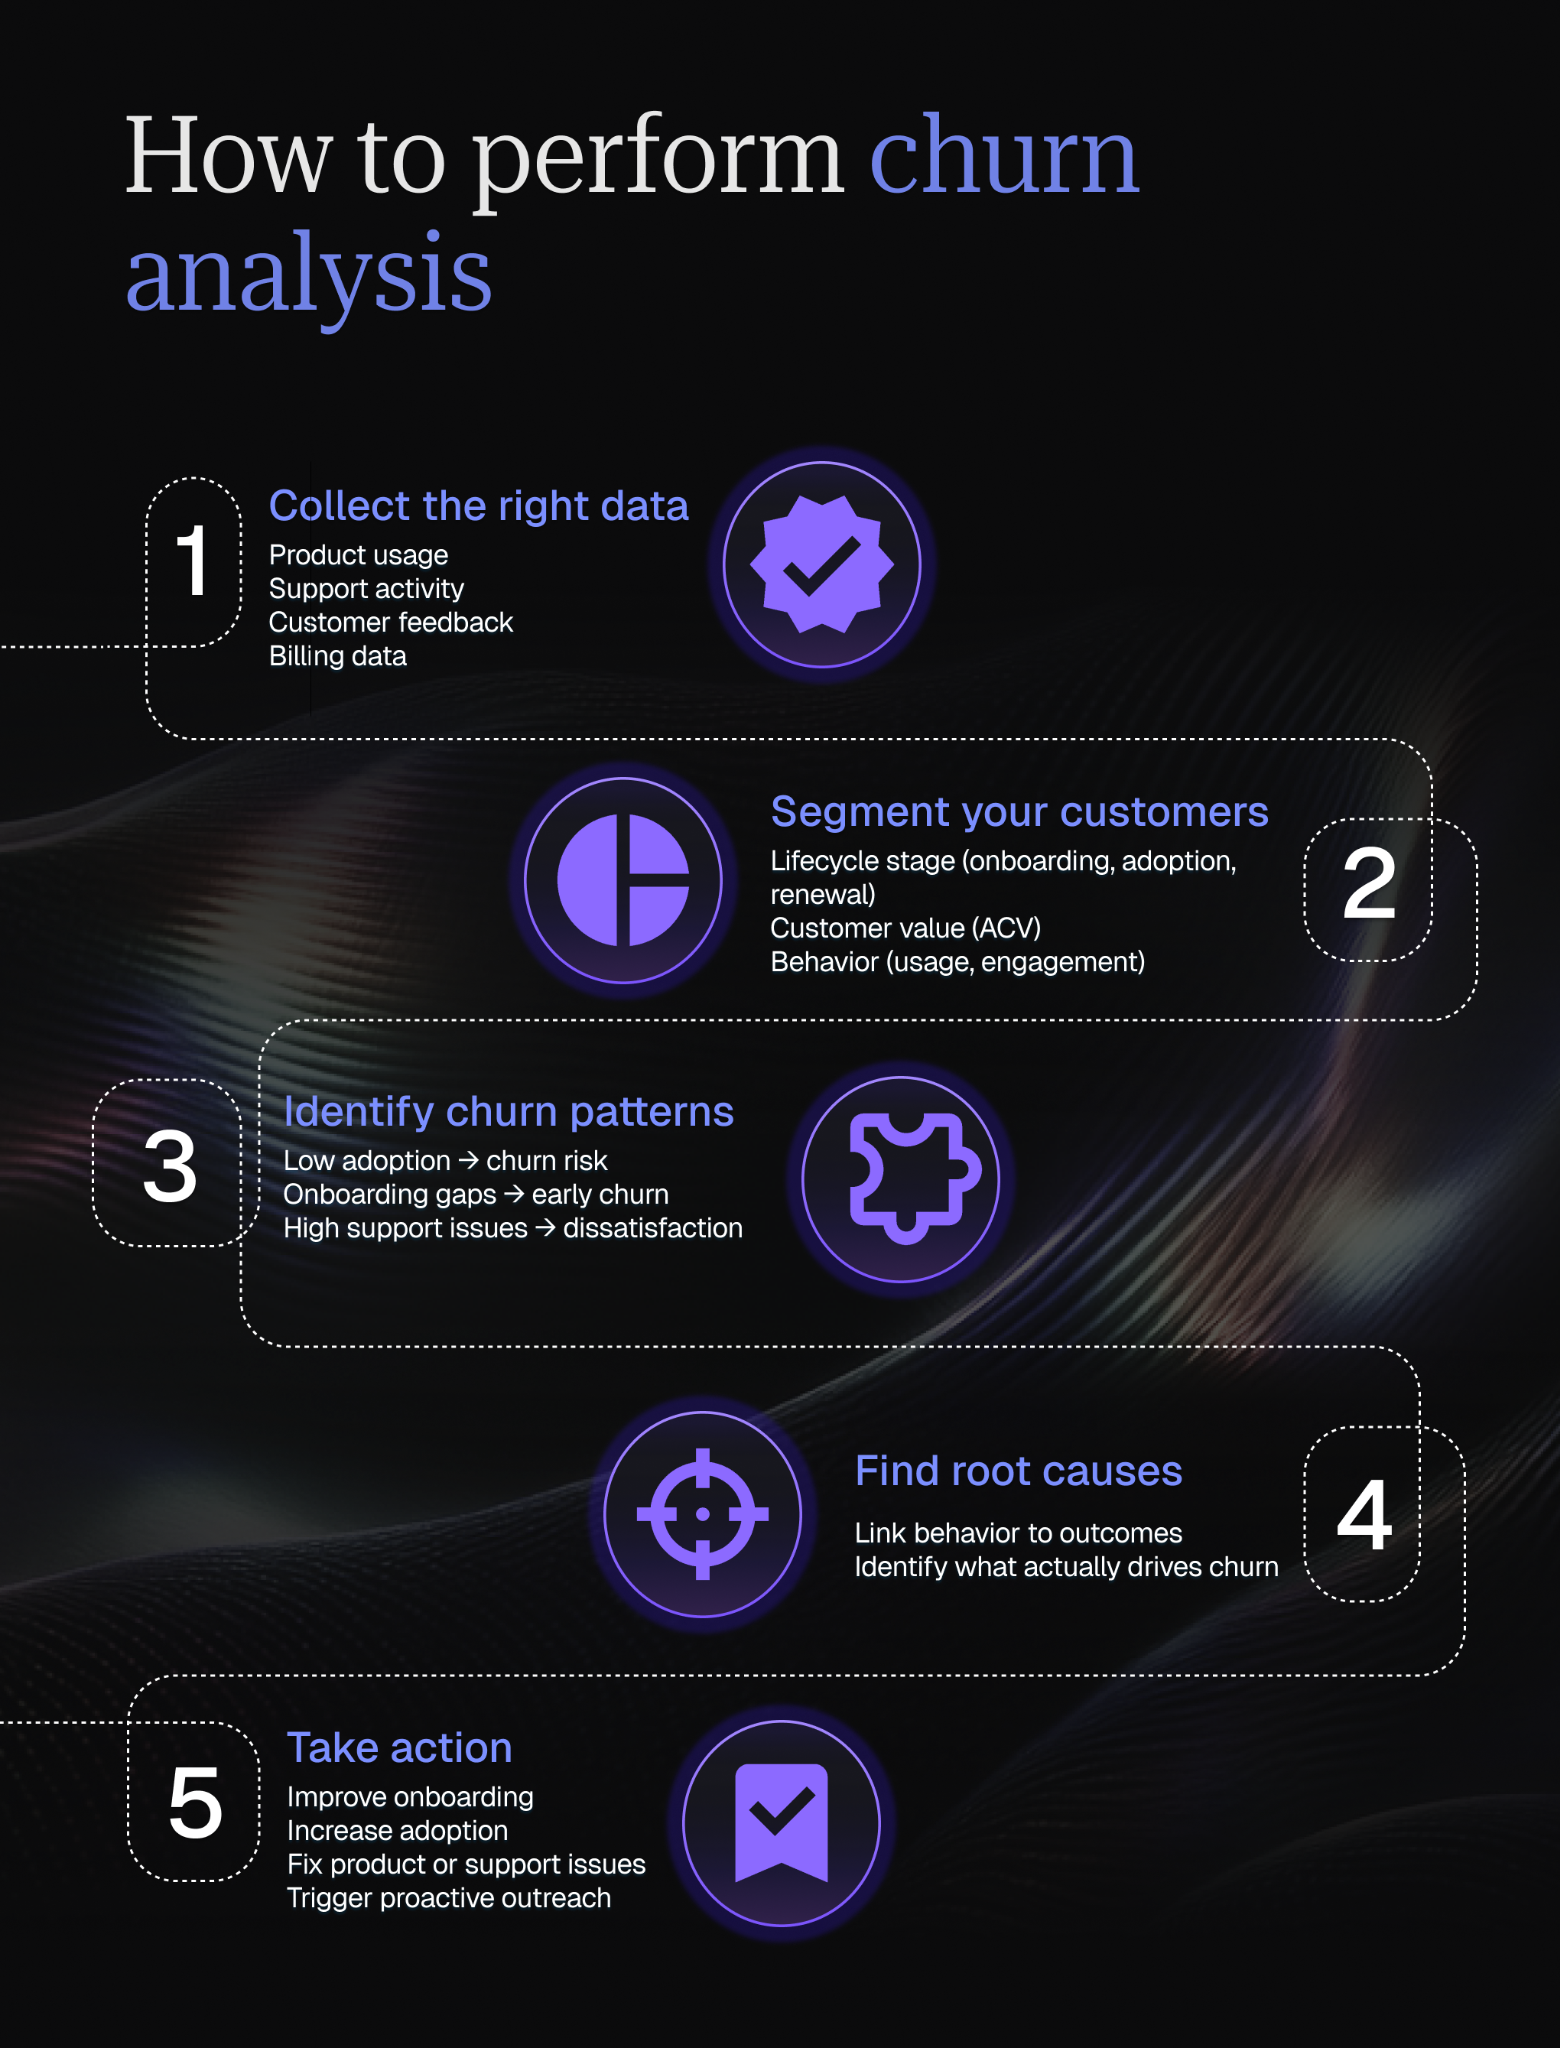
Step 1: Collect the right data
Start by gathering the data that reflects the customer experience across the full journey.
Product usage data can show whether customers are adopting the features that matter and whether engagement is rising or declining. Support data can reveal recurring issues or areas where customers repeatedly need help.
Billing data is equally important, especially for spotting failed payments, downgrades, reduced seats, or renewal delays that may give you a preliminary risk signal before the full cancellation happens.
You should also include customer feedback from surveys, reviews, calls, and CSM notes, because behavioural data alone does not always explain why something is happening. Sometimes you need to hear the customer’s voice directly to understand.
What teams should be trying to do is to construct a complete view of each account; a view that is holistic, and not dependent on a single source.
Step 2: Segment your customers
Once the data is collected, group customers in a way that makes patterns easier to spot.
Useful segmentation approaches include:
- Lifecycle stage such as onboarding, adoption, or renewal
- Customer value such as ACV or revenue contribution
- Behavior such as usage frequency, engagement, or support activity
Segmentation helps reveal whether churn is concentrated within specific groups rather than spread evenly across the customer base.
Step 3: Identify churn patterns
With your segments in place, look for trends that appear repeatedly among churned or at-risk customers.
For example, customers in onboarding may churn when they take too long to reach value or fail to complete key setup milestones. Low-usage customers may become more likely to churn when feature adoption drops or when only a small number of users remain active.
High-support accounts may also show risk if they have repeated unresolved issues, long response times, or recurring complaints.
Try to move beyond isolated cases and identify recurring signals that can guide future action.
Step 4: Find root causes
Once patterns are visible, connect them back to underlying causes.
Make an effort to link customer behavior to outcomes:
- Did churn follow low product adoption?
- Did support issues increase before cancellation?
- Did customers with certain expectations leave faster than others?
Root cause analysis helps distinguish symptoms from actual drivers of churn.
Step 5: Take action
The final step is turning insights into retention strategies. Once you know where churn is happening and what is driving it, what needs to change?
For early-stage churn, this improving onboarding can be a good start. Look to reduce time to value, or add clearer milestones so customers are familiar with how the progression should go.
For low-usage accounts, it could mean creating targeted engagement campaigns or highlighting underused features. You might also want CSMs to reach out before an account that looks to be disengaging churns.
If the same product or support issues appear repeatedly, those insights should be shared with the relevant teams and be fixed as soon as possible.
Churn analysis is valuable if and when it leads to action. You need to keep in mind the goal of understanding why customers leave, but more importantly, to reduce the chances of it happening again.
Cohort analysis as a churn analysis technique
Cohort analysis is one of the most useful techniques for understanding when churn happens and whether it is improving or worsening over time.
Instead of looking at all customers as one group, cohort analysis groups customers by a shared starting point, such as the month or quarter they signed up, were onboarded, or became active. You then track how many customers from each cohort stay over time.
For example, you might compare customers who joined in January, February, and March, then measure what percentage of each group is still active after one month, three months, six months, and so on. It’s now easier to see whether churn is concentrated in specific acquisition batches or happening consistently across your customer base.
How cohort tables reveal churn patterns
A cohort table helps you spot patterns that are easy to miss in a single churn rate.
If one cohort drops sharply in month two or three, the issue may be linked to onboarding, time to value, sales expectations, or early product adoption. Customers may be signing up, but not reaching enough value quickly enough to continue.
If every cohort declines gradually over time, the issue may be less about onboarding and more about long-term engagement. This could point to weak product stickiness, lack of ongoing value, limited feature adoption, or poor renewal preparation.
If newer cohorts retain better than older ones, it may suggest that recent onboarding, product, or Customer Success improvements are working. If newer cohorts perform worse, it may signal that the business is attracting less-fit customers or that recent changes have introduced friction.
How CS teams can use cohort analysis
For Customer Success teams, cohort analysis is especially useful for auditing the customer journey.
If you changed your onboarding process in April, you can compare retention for customers onboarded before and after that change. If the newer cohorts retain better, that gives you evidence that the intervention is working.
If there is no improvement, it may mean the problem sits somewhere else, such as product adoption, support experience, or expectation setting during sales.
Cohort analysis can also help teams measure the impact of retention playbooks. For example, if you introduce proactive outreach for low-usage accounts, you can track whether cohorts exposed to that playbook retain better than earlier cohorts.
The limitation of cohort analysis
Cohort analysis shows where churn is concentrated, but it does not always explain why it is happening.
A cohort table might show that customers acquired in Q2 churn faster than customers acquired in Q1, but it will not tell you whether the cause was poor onboarding, weak product fit, pricing concerns, support issues, or a change in customer expectations.
That is why cohort analysis should be paired with qualitative research. Customer interviews, cancellation reasons, support tickets, survey responses, and CSM notes help explain the patterns behind the numbers.
Used together, cohort data and qualitative feedback give Customer Success teams a clearer picture of both when churn happens and what needs to change to prevent it.
How to operationalize churn analysis
Churn analysis only drives impact when insights are turned into consistent action. The goal is to move from understanding churn to actively preventing it through structured workflows and repeatable processes.
Turn insights into workflows
Insights should directly translate into actions.
For example:
- A drop in usage → trigger a check-in
- Negative feedback → escalate to support or product
- Low onboarding progress → initiate guided assistance
Defining these workflows ensures that signals don’t get ignored.
Build retention playbooks
Retention playbooks standardize how teams respond to common churn risks.
These can include:
- Early-stage onboarding recovery plans
- Engagement campaigns for low-usage accounts
- Renewal preparation workflows
Playbooks make it easier to respond quickly and consistently across accounts.
Trigger proactive outreach
Instead of waiting for customers to churn, reach out based on early warning signals.
Examples include:
- Declining engagement
- Increased support activity
- Negative sentiment
Proactive outreach helps address issues before they escalate.
Monitor continuously
Do you only review churn analysis after a bad quarter or a wave of cancellations? If so, consider making it an ongoing process. Customer behaviour changes constantly, and the earlier you spot those changes, the more time you have to intervene.
Track churn metrics regularly, but also monitor the signals that come before churn, such as declining usage, lower feature adoption, reduced stakeholder engagement, increased support activity, or negative sentiment.
Continuous monitoring also allows teams to update their retention strategies as new patterns arise. If a risk signal that mattered six months ago is no longer predictive, or a new churn pattern starts appearing in a specific segment, your workflows and playbooks need to evolve with it.
Improve onboarding
Many churn issues originate early in the customer journey.
Focus on:
- Reducing time to value
- Providing clear guidance and milestones
- Identifying customers who are stuck early
Improving onboarding can significantly reduce early-stage churn.
Increase adoption
Customers are more likely to stay when the product becomes an integral part of how they work. Shallow usage, or usage that is inconsistent and limited to only a few users, will probably lead to the account struggling to justify renewal.
To improve adoption, CS teams should highlight the features and use cases most closely tied to the customer’s goals.
Help them discover underused functionality, show them better ways to complete key workflows, or encourage more users across the account to engage with the product.
Adoption too should be monitored over time. A customer may start strong after onboarding but gradually reduce usage as priorities change or internal champions leave. Spot those changes early, so as to give your team a chance to re-engage the account before low adoption turns into churn risk.
Personalize engagement
Generic communication often fails to address specific customer needs, leading to more churn.
Tailor outreach based on:
- Customer goals
- Usage patterns
- Lifecycle stage
Personalized engagement reinforces value and builds stronger relationships. It’s also tied to stronger commercial outcomes. McKinsey reports that personalization can lift revenue by 5–15% and that faster-growing companies derive 40% more of their revenue from personalization than slower-growing peers.
Conduct churn interviews
Post-cancellation surveys can capture basic churn reasons, but interviews often uncover more honest and useful context. Customers may give polite written answers like “budget” or “changed priorities,” while a conversation can reveal when the relationship actually started to break down.
Prioritize interviews with recently churned mid-to-high ARR accounts, especially when the churn was unexpected. Start by asking what the customer was trying to achieve, then explore where friction began, and finally ask whether they moved to another solution and why.
Avoid leading questions, defending the product, or trying to solve the issue during the call. The goal is to understand the churn clearly, not to debate it.
After each interview, tag themes such as onboarding gaps, missing functionality, low adoption, pricing concerns, support issues, stakeholder change, or competitor switch. These patterns can then feed back into retention playbooks, product decisions, and future churn analysis.
Use churn data to learn about your competitors
Churn data can also reveal where competitors are winning your accounts, not just why customers are leaving.
Track competitor mentions in cancellation reasons, churn interviews, support conversations, and CSM notes. Then categorize competitive churn by the main driver: price, missing features, relationship issues, or strategic changes such as consolidation after an acquisition.
These patterns can be useful across the business. Sales can use them to improve objection handling, product can use them to prioritize recurring gaps, and marketing can use them to sharpen positioning.
It is also worth asking whether competitive churn points to an ICP issue. If the same type of customer keeps leaving for the same competitor, the answer may not be to compete harder. It may be to revisit who you are selling to, what expectations are being set, and where your product is strongest.
Fix product gaps
Churn often reveals product issues that need to be addressed.
This includes:
- Difficult or confusing features
- Missing functionality
- Poor user experience
Closing these gaps improves satisfaction and reduces long-term churn.
How to monitor and improve churn analysis
Churn analysis is not a one-time exercise. To be effective, it needs to be continuously monitored, refined, and tied to action. The goal is to evolve from static reporting to a dynamic system that improves over time.
Set up continuous monitoring
Churn should be tracked on an ongoing basis, not just reviewed occasionally.
- Monitor churn metrics weekly or monthly
- Track trends across segments, not just overall churn
- Identify early warning signals such as drops in usage, spikes in support activity, or shifts in sentiment
This helps teams catch issues early rather than reacting after churn occurs.
Build feedback loops into your process
If data reveals where churn is happening, feedback is what explains why it’s happening. Usage drops, support spikes, and declining engagement are all useful signals, but they need to be situated in the context of the customer experience to become actionable.
Collect feedback from churned customers through exit surveys, churn interviews, or cancellation conversations. At the same time, capture ongoing feedback from active customers through check-ins, support interactions, surveys, and CSM notes. This helps you understand whether the same issues are showing up before customers leave.
Top-tier churn analysis combines qualitative feedback with quantitative data. You can act far more confidently when customer comments, product usage, support history, and renewal behaviour all point to the same issue.
Use leading indicators
Churn rate tells you what already happened; it is a lagging indicator. Leading indicators help you predict what will happen next.
In addition to churn rate, investigate signals like:
- Product usage trends
- Feature adoption rates
- Engagement levels
- Support ticket patterns
These indicators allow teams to intervene before churn becomes inevitable.
Continuously refine your churn model
Customer behavior evolves, and your churn analysis should evolve with it.
- Revisit segmentation as your customer base grows or changes
- Update risk indicators based on new patterns
- Test and improve predictive models over time
Refinement ensures your analysis remains accurate and relevant.
Turn insights into action consistentlyInsights are valuable only insofar as they change what the team does next. Once churn risks are identified, they should be tied to clear workflows so that at-risk accounts never go unnoticed.
For example, a drop in usage might trigger a CSM check-in, negative sentiment might prompt an escalation, and repeated onboarding delays might start a recovery playbook. Each signal should have an owner, a next step, and a timeline for follow-up.
Consistency makes churn analysis scalable. Teams that respond to risk in a structured way tend to be less dependent on individual judgment and less likely to miss accounts that need attention.
Measure the impact of your interventions
To improve churn analysis, you need to understand what’s working.
- Track retention improvements over time
- Compare churn rates before and after changes
- Evaluate which actions reduce churn most effectively
This closes the loop, helping teams double down on strategies that drive real results.
How AI is transforming churn analysis
AI is fundamentally changing how churn analysis is approached, shifting it from a retrospective exercise to a proactive system. Instead of relying on historical reports to understand why customers left, teams can now anticipate churn before it happens and intervene early.
CS teams have already demonstrated willingness to include AI in their churn analysis process. In Velaris’ State of AI in Customer Success report, 27% of CS teams said they use AI for predicting churn and expansion, 32% use it for generating health scores, and 35% use it for analyzing customer feedback.
These are all core inputs for churn analysis, and are made possible through proactive AI use.
Predictive churn detection
Rather than analyzing churn after the fact, AI models evaluate patterns across usage, engagement, and historical behavior to identify which customers are most likely to leave.
Teams can then prioritize their efforts more effectively and focus on accounts where intervention can definitively change the outcome.
This is closely tied to the ability to identify risk early. AI continuously monitors signals such as declining product usage, reduced engagement, or changes in activity patterns.
These subtle shifts often happen well before a customer formally churns, giving teams a window to step in and re-engage them before the situation escalates.
Real-time sentiment analysis
Customers don’t always express dissatisfaction through metrics alone, but it often shows up in conversations, support tickets, and feedback. AI can analyze these interactions to detect tone and sentiment, helping teams uncover dissatisfaction that might otherwise go unnoticed until it is too late.
By combining behavioral data with sentiment signals, AI enables a more complete understanding of customer health.
For example, a slight drop in usage might not seem critical on its own, but when paired with repeated complaints or negative sentiment, it becomes a much stronger indicator of churn risk. This multi-layered view allows teams to make more informed decisions and act with greater confidence.
Automated insights
Instead of manually analyzing large datasets, AI can surface patterns, trends, and anomalies in real time. This reduces the reliance on manual reporting and makes churn analysis faster and more accessible, especially as customer bases grow.
Platforms like Velaris, a highly rated software on G2, bring these capabilities together by combining unified customer data with AI-driven insights such as Headlines, AI Topics, and CallSense, allowing teams to detect churn signals early and trigger proactive workflows.
This makes churn analysis not just something teams review periodically, but something that continuously informs how they engage with customers.
However, as promising as AI-generated automated insights appear to be, having a degree of human review is still a good idea. Velaris’ report found that 82% of CS professionals regularly need to fix AI outputs, demonstrating that there is still room for error.
For churn analysis, this means AI can help surface patterns faster, but CS teams should still validate those insights before changing playbooks, escalating accounts, or making product decisions.
Ultimately, AI transforms churn analysis from a static report into a dynamic system that helps teams prevent churn, as long as it has adequate human scrutiny
Tools needed for effective churn analysis
Effective churn analysis depends on having the right tools to collect, interpret, and act on customer data. Without a solid toolset, teams often struggle with fragmented insights, delayed responses, and missed opportunities to prevent churn.
Data collection tools
Data collection tools form the foundation. These include systems that capture product usage, customer interactions, support activity, and feedback.
With these tools, you aim to gather a complete and accurate picture of how customers are engaging with your product across every touchpoint.
Analytics platforms
Analytics platforms enable segmentation, trend analysis, and pattern recognition, allowing teams to identify where churn is happening and what behaviors typically precede it. Without this layer, data remains isolated and difficult to act on.
Customer Success platforms
Customer Success platforms bring everything together by connecting data with action. Instead of just analyzing churn, these platforms help teams operationalize insights through workflows, health scoring, and proactive engagement.
They act as the bridge between understanding churn and actually reducing it in practice.
How Velaris helps with churn analysis
Platforms like Velaris are designed specifically for this purpose, unifying customer data across systems to provide a single source of truth. By combining behavioral data with AI-driven insights into risk and engagement patterns, teams can identify churn signals earlier and with greater accuracy.
With Copilot recommending next best actions based on real-time context, teams can move quickly from insight to execution, making churn analysis a continuous and actionable process rather than a periodic review.
What are the biggest mistakes in churn analysis?
Looking at churn too late
One of the most common mistakes is treating churn analysis as a retrospective exercise. When teams only analyze churn after customers have already left, they miss the opportunity to intervene.
Churn signals often appear much earlier in the customer journey, through declining usage, reduced engagement, or subtle shifts in behavior. Focusing too heavily on past churn instead of identifying early warning signs limits the ability to prevent it.
Ignoring qualitative feedback
Relying only on quantitative data like usage metrics or churn rates can create an incomplete picture. While these numbers show what is happening, they don’t explain why.
Qualitative feedback from customer conversations, support tickets, and surveys provides critical context. Ignoring this input can lead to incorrect assumptions and ineffective solutions.
Not acting on insights
Churn analysis only creates value when it leads to action. Many teams invest time in collecting and analyzing data but fail to translate insights into workflows, playbooks, or interventions.
Without clear next steps, even accurate analysis has little impact. The goal is to ensure that every insight directly informs how teams engage with customers and reduce churn moving forward.
Conclusion
Churn analysis is the foundation for improving retention in any SaaS business. It gives you visibility into why customers leave and where your experience is falling short, allowing you to make more informed decisions.
However, insights alone are not enough. The real impact comes from acting on those insights consistently, whether that means improving onboarding, increasing adoption, or addressing product gaps. Teams that operationalize churn analysis see far better outcomes than those that treat it as a reporting exercise.
AI and automation are what make this scalable. They allow teams to detect risk earlier, prioritize the right accounts, and respond in real time without relying entirely on manual effort.
Platforms like Velaris, a well-rated tool on G2, help bring this together by combining unified customer data, AI-driven insights, and automated workflows, making it easier to identify churn risks early and act on them before they impact retention.
Book a demo to see how Velaris helps you identify churn risks early and act faster.
Frequently Asked Questions
What is a good churn rate for SaaS?
A “good” churn rate depends on your segment, pricing, and business model. For most SaaS companies, a monthly churn rate of 3–5% or lower is considered healthy, while enterprise-focused businesses often aim for even lower. The key is not just benchmarking, but consistently improving your churn rate over time.
How do you calculate churn rate?
Churn rate is calculated by dividing the number of customers lost during a period by the total number of customers at the start of that period.
For example, if you start the month with 1,000 customers and lose 50, your churn rate is 5%. This can be calculated for both customers (logo churn) and revenue (revenue churn), depending on what you want to measure.
When should you not fight churn?
Not every churn risk is worth saving.
Some accounts are too low-fit, low-value, or operationally heavy to justify repeated retention efforts. This is especially true when the customer needs a product you do not offer, consistently drains team capacity, or creates friction without a realistic path to long-term value.
In these cases, the goal should shift from “save the account” to “manage the exit well.”
CS teams can use churn analysis to identify when an account is no longer a good fit based on factors like ARR, support burden, product mismatch, renewal likelihood, and strategic value.
Letting the right customers go gracefully can protect team capacity, improve focus on better-fit accounts, and create a more honest relationship with the customer.
What is the difference between churn and retention?
Churn measures the percentage of customers who leave, while retention measures the percentage who stay.
They are closely related. If your churn rate is 5%, your retention rate is 95%. While churn highlights loss, retention focuses on long-term value and growth.
Do stated churn reasons sometimes differ from customer behaviour?
Yes. Sometimes, customers don’t give their full reason for leaving. A churned customer might say “budget” because it feels polite or easy, while the behavioural data shows low adoption, repeated support issues, or lack of clear ROI.
That is why churn analysis should compare what customers say with what they actually did before leaving. Look at product usage, feature adoption, support history, CSM notes, survey responses, and exit interview themes together.
If a customer says pricing was the issue, but usage had dropped for three months and onboarding milestones were never completed, the real driver may be poor value realization rather than cost.
The goal is not to dismiss what the customer says. It is to triangulate the stated reason with behavioural and qualitative signals so you can identify the true root cause.
This helps teams avoid fixing the wrong problem. “Budget” may call for pricing changes, while “low adoption” may point to better onboarding, clearer success plans, or stronger value reinforcement.
How often should you perform churn analysis?
Churn analysis should be continuous rather than periodic.
While metrics are often reviewed monthly or quarterly, the underlying signals like usage, engagement, and sentiment should be monitored in real time. This allows teams to detect risk early and act before customers churn.
What tools help reduce churn?
Reducing churn requires tools that combine data, insights, and action.
Customer Success platforms like Velaris help by unifying customer data, identifying at-risk accounts through health scoring and AI insights, and triggering automated workflows for proactive intervention. This makes it easier to move from analyzing churn to actively preventing it.
The Velaris Team
A (our) team with years of experience in Customer Success have come together to redefine CS with Velaris. One platform, limitless Success.

Velaris is an AI-native Customer Success Platform built for mid-market and enterprise B2B SaaS teams. From customer health scoring and churn prediction to onboarding automation, renewals, and expansion workflows, Velaris helps recurring revenue teams understand account health, reduce churn, and scale customer success with greater visibility and control.